Boston, MA – February 28, 2023: Flywire Corporation (Nasdaq: FLYW) (“Flywire” or the “Company”) a global payments enablement and software company, today reported financial results for its fourth quarter and fiscal-year ended December 31, 2022.
“Our excellent results in the fourth quarter capped off a tremendous year for Flywire. We continued to execute against our growth strategies, combined with increased demand for our solutions across our education, healthcare, travel and B2B verticals,” said Mike Massaro, CEO of Flywire. “After a significant investment year in 2022 that delivered exceptional results, we feel more confident than ever that we can scale our business efficiently as we head into 2023. With a focus on driving growth in core markets and industries, we plan to continue to execute against our winning strategy, including optimizing our Go-To-Market capabilities, deepening our Flywire Advantage, and strengthening our FlyMate community. We look forward to capitalizing on the momentum behind us to keep penetrating the substantial TAMs in the industries that we serve, and deliver even more value for our clients, payers, and partners.”
Fourth Quarter 2022 Financial Highlights:
GAAP Results
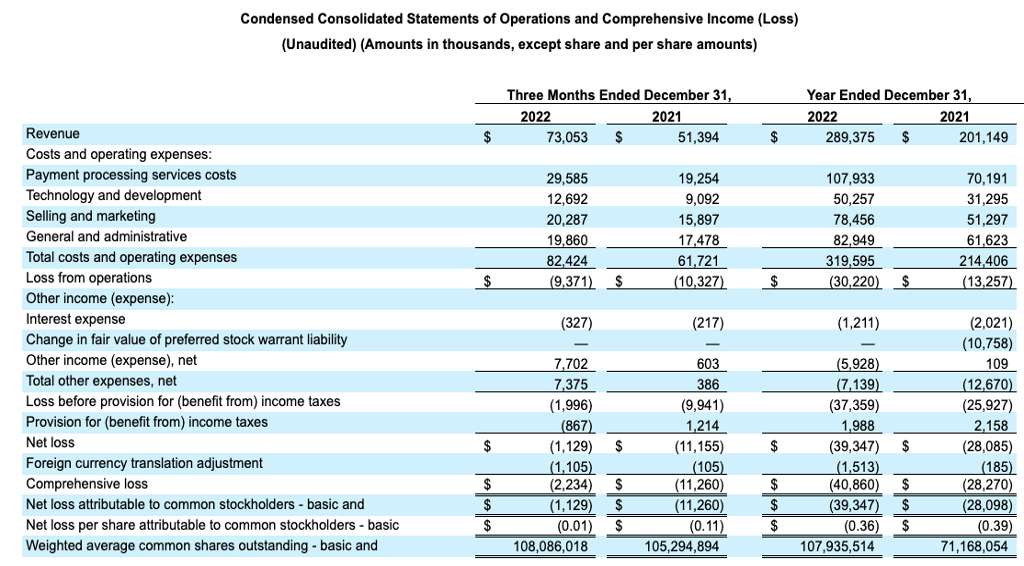
- Revenue increased 42% to $73.1 million in the fourth quarter of 2022, compared to $51.4 million in the fourth quarter of 2021.
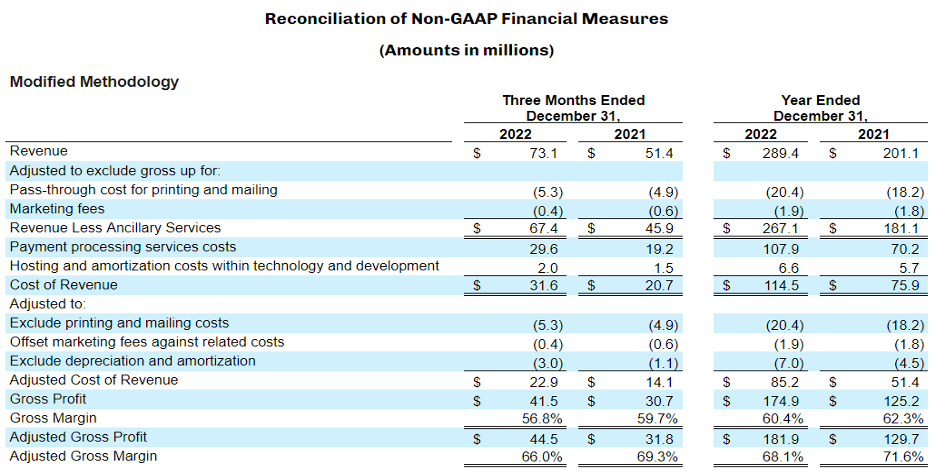
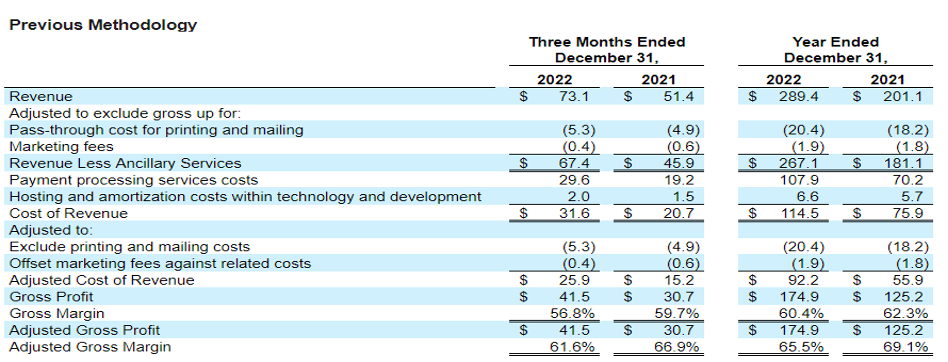
- Gross Profit increased to $41.5 million, resulting in Gross Margin of 56.8%, for the fourth quarter of 2022, compared to Gross Profit of $30.7 million and Gross Margin of 59.7% in the fourth quarter of 2021.
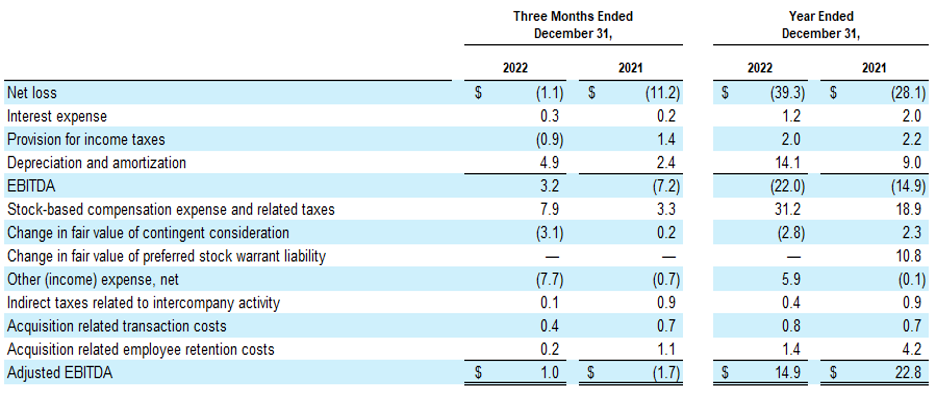
- Net loss was $1.1 million in the fourth quarter of 2022, compared to net loss of $11.2 million in the fourth quarter of 2021.
Key Operating Metrics and Non-GAAP Results
- Total Payment Volume increased 29% to $4.1 billion in the fourth quarter of 2022, compared to $3.1 billion in the fourth quarter of 2021.
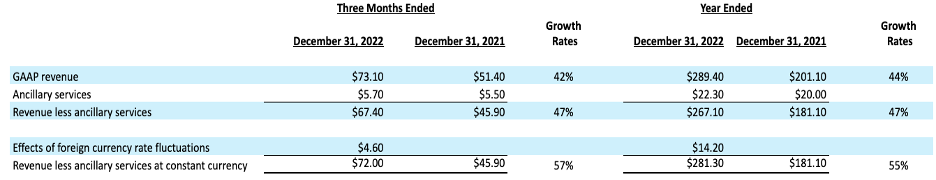
- Revenue Less Ancillary Services increased 47% to $67.4 million in the fourth quarter of 2022, compared to $45.9 million in the fourth quarter of 2021.
- Revenue Less Ancillary Services was unfavorably impacted by foreign currency exchange rates year-over-year by $4.6 million
- Revenue Less Ancillary Services at Constant Currency was 57%
- Adjusted Gross Profit increased to $44.5 million, resulting in Adjusted Gross Margin of 66.0% in the fourth quarter of 2022, compared to Adjusted Gross Profit of $31.8 million and Adjusted Gross Margin of 69.3% in the fourth quarter of 2021. Prior year Adjusted Gross Profit and Adjusted Gross Margin have been recast to align with the updated methodology as described in the Key Operating Metrics and Non-GAAP Financial Measures table below.
- Adjusted EBITDA was $1.0 million in the fourth quarter of 2022, compared to $(1.7) million in the fourth quarter of 2021.
Fiscal-Year 2022 Financial Highlights1:
GAAP Results
- Revenue increased 44% to $289.4 million in fiscal-year 2022, compared to $201.1 million in fiscal-year 2021.
- Gross Profit increased to $174.9 million, resulting in Gross Margin of 60.4% in fiscal-year 2022, compared to Gross Profit of $125.2 million and Gross Margin of 62.3% in fiscal-year 2021.
- Net loss was $39.3 million in fiscal-year 2022, compared to net loss of $28.1 million in fiscal-year 2021.
Key Operating Metrics and Non-GAAP Results:
- Total Payment Volume increased 37% to $18.1 billion in fiscal-year 2022, compared to $13.2 billion in fiscal-year 2021.
- Revenue Less Ancillary Services increased 47% to $267.1 million in fiscal-year 2022, compared to $181.1 million in fiscal-year 2021.
- Revenue Less Ancillary Services was unfavorably impacted by foreign currency exchange rates year-over-year by approximately $14.2 million
- Revenue Less Ancillary Services at Constant Currency was 55%
- Adjusted Gross Profit of $181.9 million, resulting in Adjusted Gross Margin of 68.1% in 2022, compared to Adjusted Gross Profit of $129.7 million and Adjusted Gross Margin of 71.6% in fiscal-year 2021. As noted above, prior year Adjusted Gross Profit and Adjusted Gross Margin have been recast to align with the updated methodology for calculating these non-GAAP measures.
- Adjusted EBITDA was $14.9 million in fiscal-year 2022, compared to $22.8 million in fiscal-year 2021.
Fiscal-Year 2022 Business Highlights:
- Signed more than 590 new clients in 2022 and now serve over 3,100 clients globally
- Recorded strong average annual dollar-based net revenue retention (NRR) in fiscal-year 2022 of 124%
- Accelerated product and payment innovation with new 529 disbursement solution, connecting more than 600 institutions through Flywire’s Ascensus partnership
- Strengthened its ecosystem of global strategic partners in education and announced partnerships with Adapt IT, Tribal Group, and Universitas XXI
- Successfully integrated the WPM business and signed more than 40 clients for the combined solution
- More than tripled revenues of the travel vertical in response to market demand for Flywire’s solution as highlighted in Flywire’s annual luxury travel report for destination management companies, accommodations providers and tour operators
- Completed the acquisition of Cohort Go and efficiently integrated it into the education vertical, enhancing Flywire’s Educational Agent solution and adding unique capabilities to the Flywire offering
- Signed more than 15 new clients in healthcare and expanded services with 22 existing ones, with growth underpinned by a 269% ROI of Flywire’s solution for hospitals and health systems
- Enhanced its proprietary global payment network through the partnership with HDFC Bank in India, providing an open banking experience to India payers and further enhancing one of Flywire’s strategic competitive barriers
- Strengthened its channel partnership strategy in the B2B vertical with a partnership with Huntington Bank, the 15th largest bank in the US
- Gained recognition for its award-winning global culture, including being certified as a Great Place to Work®, being named to Inc. Magazine’s Best Workplaces of 2022, and Fortune Magazine’s Best Workplaces in Financial Services 2022
- Released the company’s inaugural Environmental, Social, and Governance (ESG) report, outlining the company’s first comprehensive summary about how it integrates social good initiatives into its business strategy
First Quarter and Fiscal-Year 2023 Outlook:
Based on information available as of February 28, 2023, Flywire anticipates the following for the first quarter and fiscal-year 2023:
First Quarter 2023 | |
Revenue | $85 to $91 million |
Revenue Less Ancillary Services | $81 to $85 million |
Adjusted EBITDA* | $3 to $5 million |
Fiscal-Year 2023 | |
Revenue* | $373 to $392 million |
Revenue Less Ancillary Services | $353 to $364 million |
Adjusted EBITDA** | $28 to $34 million |
*Fiscal year 2023 expectations reflect the Company’s organic revenue expectations and annualization of the Cohort Go business. The Company has assumed Foreign exchange rates prevailing as of December 31, 2022.
**Flywire has relied upon the exception in item 10(e)(1)(i)(B) of Regulation S-K and has not provided a quantitative reconciliation of forecasted Adjusted EBITDA to forecasted GAAP net income (loss) or to forecasted GAAP income (loss) before income taxes within this earnings release because Flywire is unable, without making unreasonable efforts, to calculate certain reconciling items with confidence. These items include, but are not limited to income taxes which are directly impacted by unpredictable fluctuations in the market price of Flywire's stock.
These statements are forward-looking and actual results may differ materially. Refer to the “Safe Harbor Statement” below for information on the factors that could cause our actual results to differ materially from these forward-looking statements.
Conference Call
The Company will host a conference call to discuss fourth quarter and fiscal-year 2022 financial results today at 5:00 pm ET. Hosting the call will be Mike Massaro, CEO, Rob Orgel, President and COO, and Mike Ellis, CFO. The conference call can be accessed live via webcast from the Company's investor relations website at https://ir.flywire.com/. A replay will be available on the investor relations website following the call.
Financial Disclosure Advisory
The Company reports its financial results in accordance with U.S. generally accepted accounting principles (“GAAP”). The expected financial results discussed in this press release are preliminary and unaudited and represent the most current information available to the company’s management, as financial closing and audit procedures for the year ended December 31, 2022 are not yet complete. These estimates are not a comprehensive statement of the Company’s financial results for the fourth quarter and fiscal year ended December 31, 2022, and actual results may differ materially from these estimates as a result of the completion of year-end financial reporting process, finalization of the processes and procedures required by Section 404(b) of the the Sarbanes-Oxley Act of 2002, completion of the procedures relating to management's assessment of the effectiveness of the Company’s internal controls, the completion of the external audit by the Company’s independent registered public accounting firm, and the subsequent occurrence or identification of events prior to the formal issuance of the audited financial statements for fiscal year 2022. In addition, results presented in this press release or on the conference call do not present all information necessary for an understanding of the Company’s financial condition and results of operations as of and for the quarter and year ended December 31, 2022.
Key Operating Metrics and Non-GAAP Financial Measures table
Flywire uses non-GAAP financial measures to supplement financial information presented on a GAAP basis. The Company believes that excluding certain items from its GAAP results allows management to better understand its consolidated financial performance from period to period and better project its future consolidated financial performance as forecasts are developed at a level of detail different from that used to prepare GAAP-based financial measures. Moreover, Flywire believes these non-GAAP financial measures provide its stakeholders with useful information to help them evaluate the Company’s operating results by facilitating an enhanced understanding of the Company’s operating performance and enabling them to make more meaningful period to period comparisons. There are limitations to the use of the non-GAAP financial measures presented here. Flywire’s non-GAAP financial measures may not be comparable to similarly titled measures of other companies. Other companies, including companies in Flywire’s industry, may calculate non-GAAP financial measures differently, limiting the usefulness of those measures for comparative purposes.
Flywire uses supplemental measures of its performance which are derived from its consolidated financial information, but which are not presented in its consolidated financial statements prepared in accordance with GAAP. These non-GAAP financial measures include the following:
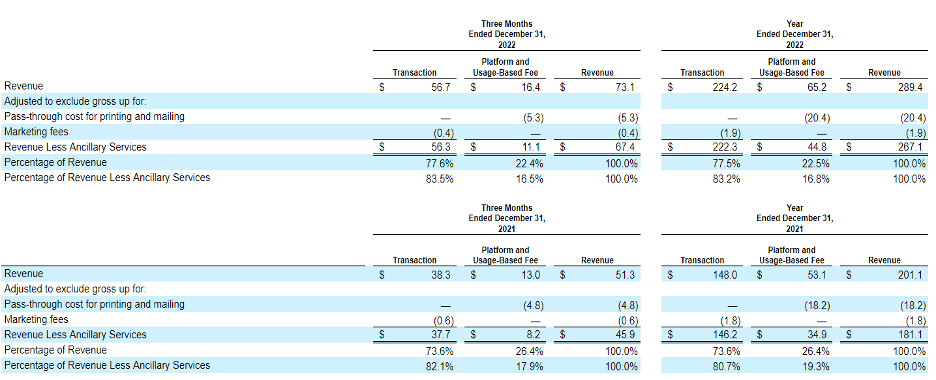
- Revenue Less Ancillary Services. Revenue Less Ancillary Services represents the Company’s consolidated revenue in accordance with GAAP after excluding (i) pass-through cost for printing and mailing services and (ii) marketing fees. The Company excludes these amounts to arrive at this supplemental non-GAAP financial measure as it views these services as ancillary to the primary services it provides to its clients.
- Adjusted Gross Profit and Adjusted Gross Margin. Adjusted gross profit represents Revenue Less Ancillary Services less cost of revenue adjusted to (i) exclude pass-through cost for printing services, (ii) offset marketing fees against costs incurred and (iii) exclude depreciation and amortization, including accelerated amortization on the impairment of customer set-up costs tied to technology integration. Adjusted Gross Margin represents adjusted gross profit divided by Revenue Less Ancillary Services. Management believes this presentation supplements the GAAP presentation of gross margin with a useful measure of the gross margin of the Company’s payment-related services, which are the primary services it provides to its clients. Beginning with the quarter ended December 31, 2022, we have excluded depreciation and amortization from the calculation of our adjusted gross profit, which we believe enhances the understanding of the Company’s operating performance and enables more meaningful period to period comparisons. Our adjusted gross profit and adjusted gross profit margin for the three and twelve months ended December 31, 2021 were recast to conform to the updated methodology and are reflected herein for comparison purposes.
- Adjusted EBITDA. Adjusted EBITDA represents EBITDA further adjusted by excluding (i) stock-based compensation expense and related payroll taxes, (ii) the impact from the change in fair value measurement for contingent consideration associated with acquisitions, (iii) the impact from the change in fair value measurement of the Company’s preferred stock warrants, (iv) other income (expense), net, (v) indirect taxes related to intercompany activity, (vi) acquisition related transaction costs, and (vii) employee retention costs, such as incentive compensation, associated with acquisition activities. Management believes that the exclusion of these amounts to calculate Adjusted EBITDA provides useful measures for period-to-period comparisons of the Company’s business.
- Revenue Less Ancillary Services at Constant Currency. Revenue Less Ancillary Services at Constant Currency represents Revenue Less Ancillary Services adjusted to show presentation on a constant currency basis. The constant currency information presented is calculated by translating current period results using prior period weighted average foreign currency exchange rates. We analyze Revenue Less Ancillary Services on a constant currency basis to provide a comparable framework for assessing how the business performed excluding the effect of foreign currency fluctuations.
These non-GAAP financial measures are not meant to be considered as indicators of performance in isolation from or as a substitute the Company’s revenue, gross margin or net income (loss) prepared in accordance with GAAP and should be read only in conjunction with financial information presented on a GAAP basis. Reconciliations of Revenue Less Ancillary Services, Revenue Less Ancillary Services at Constant Currency, Adjusted Gross Profit, Adjusted Gross Margin and Adjusted EBITDA to the most directly comparable GAAP financial measure are presented below. Flywire encourages you to review these reconciliations in conjunction with the presentation of the non-GAAP financial measures for each of the periods presented. In future fiscal periods, Flywire may exclude such items and may incur income and expenses similar to these excluded items. Flywire has relied upon the exception in item 10(e)(1)(i)(B) of Regulation S-K and has not provided a quantitative reconciliation of forecasted Adjusted EBITDA to forecasted GAAP net income (loss) or to forecasted GAAP income (loss) before income taxes within this earnings release because it is unable, without making unreasonable efforts, to calculate certain reconciling items with confidence. These items include but are not limited to income taxes which are directly impacted by unpredictable fluctuations in the market price of Flywire's stock.
About Flywire
Flywire is a global payments enablement and software company. Flywire combines its proprietary global payments network, next-gen payments platform and vertical-specific software to deliver the most important and complex payments for its clients and their customers.
Flywire leverages its vertical-specific software and payments technology to deeply embed within the existing A/R workflows for its clients across the education, healthcare and travel vertical markets, as well as in key B2B industries. Flywire also integrates with leading ERP systems, so organizations can optimize the payment experience for their customers while eliminating operational challenges.
Flywire supports more than 3,000 clients with diverse payment methods in more than 140 currencies across 240 countries and territories around the world. Flywire is headquartered in Boston, MA, USA with additional offices around the globe. For more information, visitwww.flywire.com. Follow Flywire on Twitter,LinkedIn and Facebook.
Safe Harbor Statement
This release contains forward-looking statements within the meaning of the Private Securities Litigation Reform Act of 1995, including, but not limited to, statements regarding Flywire’s future operating results and financial position, Flywire’s business strategy and plans, market growth, and Flywire’s objectives for future operations. Flywire intends such forward-looking statements to be covered by the safe harbor provisions for forward-looking statements contained in Section 21E of the Securities Exchange Act of 1934 and the Private Securities Litigation Reform Act of 1995. In some cases, you can identify forward-looking statements by terms such as, but not limited to, “believe,” “may,” “will,” “potentially,” “estimate,” “continue,” “anticipate,” “intend,” “could,” “would,” “project,” “target,” “plan,” “expect,” or the negative of these terms, and similar expressions intended to identify forward-looking statements. Such forward-looking statements are based upon current expectations that involve risks, changes in circumstances, assumptions, and uncertainties. Important factors that could cause actual results to differ materially from those reflected in Flywire's forward-looking statements include, among others, Flywire’s future financial performance, including its expectations regarding Revenue, Revenue Less Ancillary Services, and Adjusted EBITDA. Risks that may cause actual results to differ materially from these forward looking statements include, but are not limited to: Flywire’s ability to execute its business plan and effectively manage its growth; Flywire’s cross-border expansion plans and ability to expand internationally; anticipated trends, growth rates, and challenges in Flywire’s business and in the markets in which Flywire operates; the sufficiency of Flywire’s cash and cash equivalents to meet its liquidity needs; political, economic, foreign currency exchange rate, inflation, legal, social and health risks, including the ongoing effects of the COVID-19 pandemic and subsequent public health measures that may affect Flywire’s business or the global economy; Flywire’s beliefs and objectives for future operations; Flywire’s ability to develop and protect its brand; Flywire’s ability to maintain and grow the payment volume that it processes; Flywire’s ability to further attract, retain, and expand its client base; Flywire’s ability to develop new solutions and services and bring them to market in a timely manner; Flywire’s expectations concerning relationships with third parties, including strategic partners; the effects of increased competition in Flywire’s markets and its ability to compete effectively; future acquisitions or investments in complementary companies, products, services, or technologies; Flywire’s ability to enter new client verticals, including its relatively new business-to-business sector; Flywire’s expectations regarding anticipated technology needs and developments and its ability to address those needs and developments with its solutions; Flywire’s expectations regarding litigation and legal and regulatory matters; Flywire’s expectations regarding its ability to meet existing performance obligations and maintain the operability of its solutions; Flywire’s expectations regarding the effects of existing and developing laws and regulations, including with respect to payments and financial services, taxation, privacy and data protection; economic and industry trends, projected growth, or trend analysis; Flywire’s ability to adapt to changes in U.S. federal income or other tax laws or the interpretation of tax laws, including the recently enacted Inflation Reduction Act of 2022; Flywire’s ability to attract and retain qualified employees; Flywire’s ability to maintain, protect, and enhance its intellectual property; Flywire’s ability to maintain the security and availability of its solutions; the increased expenses associated with being a public company; the future market price of Flywire’s common stock; and other factors that are described in the "Risk Factors" and "Management's Discussion and Analysis of Financial Condition and Results of Operations" sections of Flywire's Annual Report on Form 10-K for the year ended December 31, 2021 and Quarterly Report on Form 10-Q for the quarter ended September 30, 2022, which are on file with the Securities and Exchange Commission (SEC) and available on the SEC's website at https://www.sec.gov/. Additional factors may be described in those sections of Flywire's Annual Report on Form 10-K for the year ended December 31, 2022, expected to be filed with the SEC in the first quarter of 2023. The information in this release is provided only as of the date of this release, and Flywire undertakes no obligation to update any forward-looking statements contained in this release on account of new information, future events, or otherwise, except as required by law.
Media Contacts
Sarah King
[email protected]
Prosek Partners
[email protected]
Investor Relations Contact:
ICR
[email protected]